
Estimated reading time: 8 minutes
We want to start this article off with a disclaimer. While keeping an eye on your site performance by checking speed is a great way to stay on top of any potential issues, it is not a cure-all. Speed results can be misleading if you forget to look at the big picture. Explore your results, but above all, trust your developers and the feedback from your customers.
It’s been common knowledge for years now, and even still, there are studies and reports coming out on how page-load speed can directly affect your sales. Google tells us that 53% of visitors will abandon your site if it takes longer than 3 seconds to load. People are busier than ever; they don’t have the time or patience to wait for a slow-loading page. With the plethora of retail options available, customers are likely to simply leave and head to a competitor. Unfortunately, it won’t matter if your customer service is better, your site is nicer, or your prices are lower if the shopper never sees your site. And now that Google is introducing site speed badges, shoppers will be warned away from your site before they even get to it.
If you’ve been finding that your bounce rates are high, and your conversions are low, your site speed may be the culprit. There are, however, some simple and free ways to test that theory.
Below are a few tools that we recommend; these sites will scan your website and produce a score for your speed. They will also provide you with some errors, or ways to resolve your speed issues. But don’t rush off and input your URLs just yet. The results you get on those tools will likely be disheartening, confusing, and frustrating. Read through this guide on how to use them in a realistic way before you give yourself some unnecessary grief.
Google PageSpeed Insights
Pingdom Site Speed
GTmetrix
STEP ONE: Enter Your URL into the tool
Select one of the tools to start with. There are others that you can use, but for the purpose of this article, we will be using the three mentioned above. Enter your site’s URL into the tool and run the analysis.
Keep in mind that the tool will test whichever page link you input. If you want to test your home page, enter that. If you find shoppers are abandoning your site once they land on a product page , try testing with a product page link.
TIP: It’s impossible to test every page of your website; for some site owners, that could be thousands of pages. Since your ecommerce site is template based, check your homepage, a category page and a product detail page. This should give you a good ‘general’ ideal on how fast or slow your pages are. You can also take a look at your Google Search Console Speed tab to get an idea of how Google rates your overall site speed.
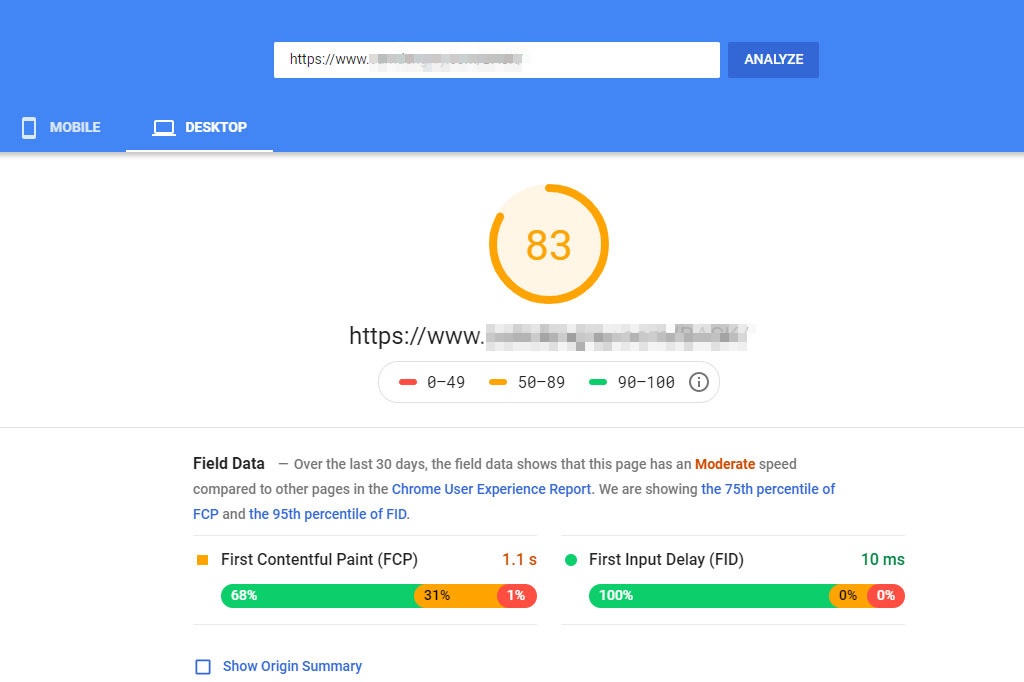
On Google’s PageSpeed Insights tool, you can view your score on both mobile and desktop. You will be presented with a score out of 100. Notice that this basket page garners a score of 83. Despite the “warning” vibe of the orange, 83 is actually a pretty great score. The Google homepage itself only scores a 91.
When you scroll further down, you will see a breakdown of your data, and diagnostics. Don’t worry if it doesn’t make much sense to you. While much of the information presented is fairly technical, there are a few things you can learn.
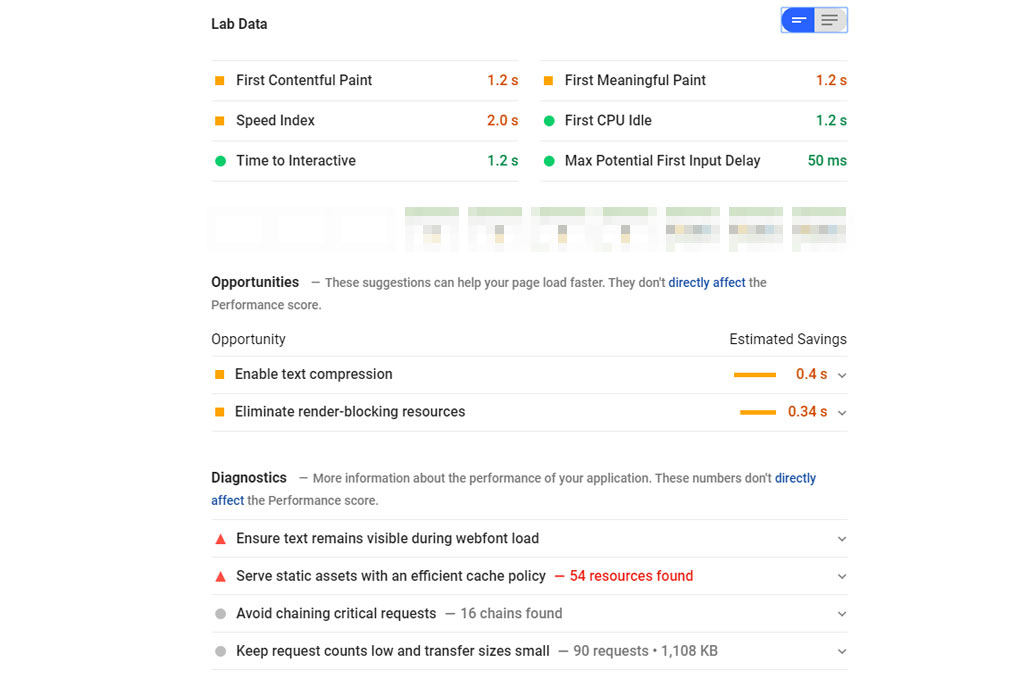
PageSpeed Insights is showing:
- Three of the Lab Data points need to be addressed, while the other three are good.
- Recommendations to improve your site performance listed as Opportunities, as well as the time they might shave off your load speed.
- A few other ways to improve your site performance are shown as drop-down menus under Diagnostics.
- Further down, you can view your Passed Audits – areas of your site that are already performing optimally.
STEP TWO: Repeat the Process With the Other Two Tools
Run the analysis again, for the same page URL, in the other two tools. This will allow you to compare your results.
Running the same test on Pingdom presents a significantly lower score of 64/100. It, too, shows where your page is struggling, and how it can be improved upon.
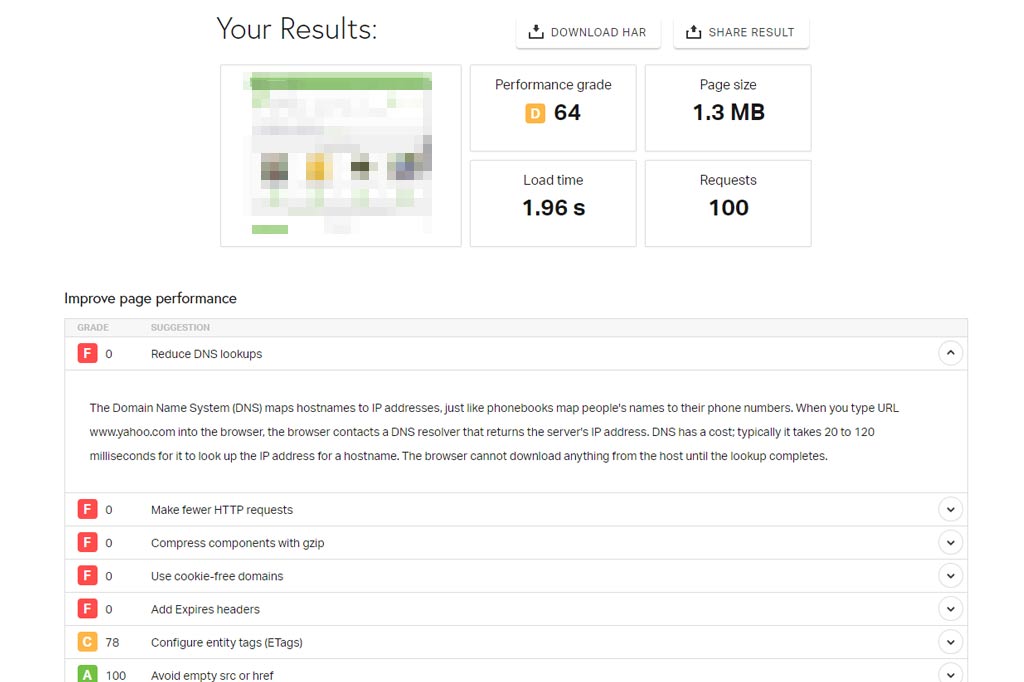
This is an example of needing to take the results with a grain of salt. While this site shows that there are several F grades, and a total performance grade of 64, it also shows that the page loads in less than 2 seconds.
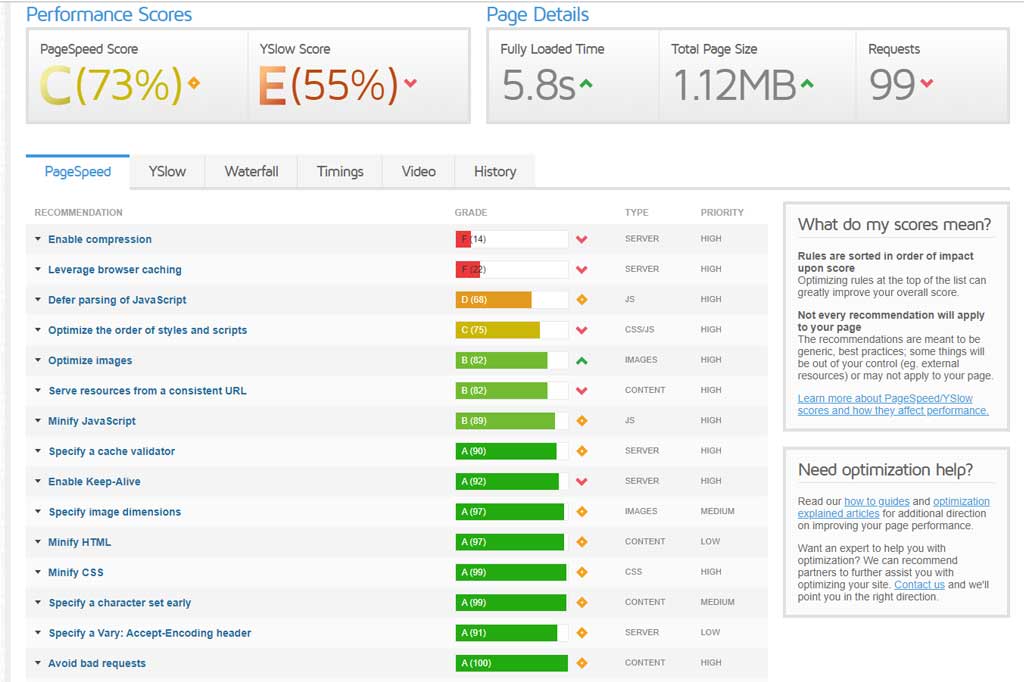
In the GTmetrix report shown below, you can see that the page is scored with a mediocre 73/100. You are again provided with areas that could benefit from some improvement. GTmatrix also provides you with information on how your score compares to the average. While the page speed score looks low, presented in that murky yellow, it is actually ranked as slightly higher than average.
STEP THREE: Find Your Averages
You’ve got your three scores from the three different tools, now it’s time to find the average. . These tools will never provide 100% accurate results, nor will they score the same all the time. You can run the test on one tool, three times in a row, and get quite different results.
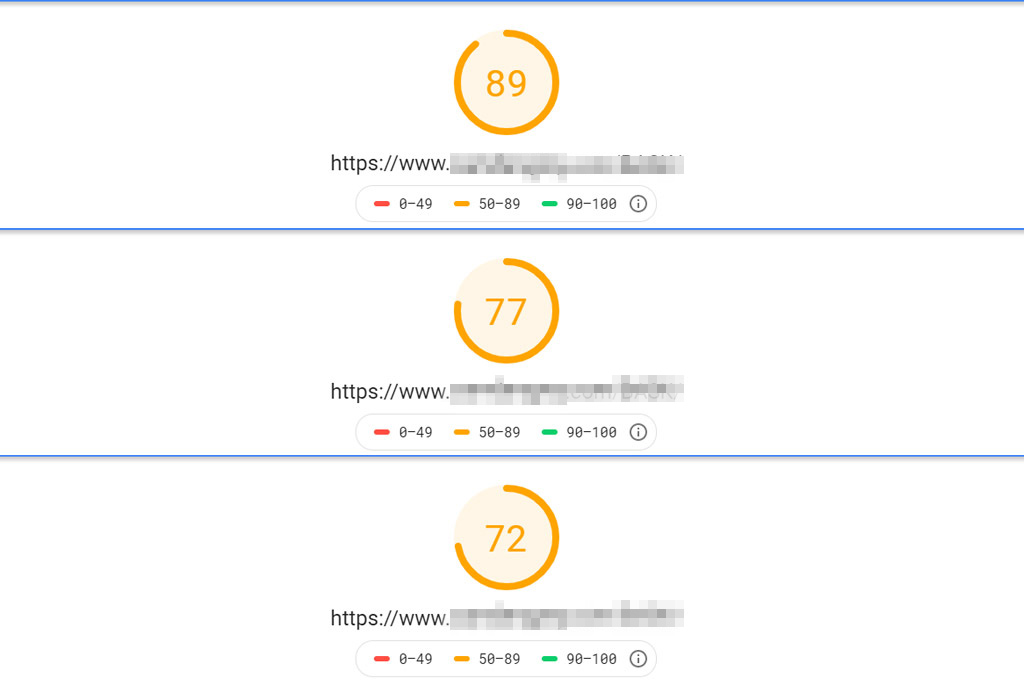
The scores you get will vary depending on a wide range of variables:
- The way the tool you’re using does its calculations
- Poor internet connection
- Web-browser add-ons
- Third party snippets on your site
- The amount of traffic currently on your site
- The amount of traffic on other sites that are using the same hosting server as your site
You may be asking yourself “Then what is the point of all this?”. Really, the point is to find the trend. Let’s go back to the three examples used about.
Average score:
(score 1 + score 2 + score 3) ÷ number of tests you ran = average score
(83+64+73) ÷ 3 = 73
Common issues:
There were a couple issues that were pointed out across all three tools.
- HTTP caching
- Compression
Because the same two points were noted across all platforms, it’s worth paying special attention to them. That’s not to say you should ignore other issues, just because they aren’t highlighted in all three tools, though. Each tool will have different metrics that they check for, so each should be considered, though not all are necessary to address.
You may, however, be provided with warnings or suggestions that are unfortunately outside of your control. For instance, third-party scripts may show caching errors but there is little that can be done to control them. The more third-party tracking snippets or applications you have on your site, the more likely it is your score will be lowered..
STEP FOUR: Consult Your Developer
While running the tests is easy enough, addressing the concerns will likely be beyond the average store owner’s capabilities. So when should you take your concerns to a developer?
- If you’re noticing that a slow load time may be affecting your visitors and your sales, it’s worth looking into some possible corrections.
- If you are running the speed tests as part of your monthly site maintenance and you notice your speeds have dropped significantly, or you’re getting new errors, have it checked out.
Testing your site speed on a regular basis is only going to get more important as the user expectations change. Make these quick tests part of your regular routine, and not just once you notice a drop-off in sales or page visits. Consider maintaining your site speed as keeping the doors of your online store open for the public. Running these tests can help ensure you are keeping the pathway to your site clear for your visitors, and it will appease the Google-gods.
While exploring your site speed tests, keep in mind that while Google has excellent resources they are, first-and-foremost, a money-making business. It’s in their best interest to tell you your site is suffering if it can lead to potential sales. If you have questions about your test results or are unhappy with your speeds, contact us and our developers can take a look. We will be able to let you know if your test results are anything to worry about, and the best way to address them.